As Normal as the Leaves Falling off of the Trees in Autumn
JP Morgan has released their quarterly Guide to the Markets and if you are a client of mine then you will be accustomed to this graph. This graph provides us with a ton of valuable information about the returns of the S&P500 (a stock market index that tracks the performance of 500 large companies listed on stock exchanges in the United States).
The grey bars show the annual return of the S&P500 in any given year. For example, we can look at the bar on the farthest right (YTD), which signifies 2021 from January 1 – September 30, and we see that the S&P500 had a YTD return of 15% on September 30, 2021. Now, look at the -5 red dot under that respective bar, which signifies the lowest point that the market achieved over that calendar year on a percentage basis. Look at the bar directly left (which signifies CoVid – 2020), we can see that the market achieved a fantastic return of 16% by the end of 2020 but experienced a decline that equated to -34% during the year.
Let’s zoom out a bit and look over the entire graph rather than focusing on one specific year. I would suggest that you do the same when you evaluate your investments because you are a multi-decade, potentially trans-generational, investor so the most recent Armageddon Du Jour that the media is latching onto shouldn’t be new to you; it’s one of the same from the past but simply rebranded. The entire graph shows the returns of the last 41 years and we can see that every single year (41 out of 41 years) the market was negative at some point in the year. Market negativity is normal and should be expected, the same way that the leaves fall off of the trees in autumn or plants begin to sprout in Spring, and anything different should be considered to be an anomaly or not normal. Market negativity at some point in a calendar year may be normal, but if history tells us anything then we should understand that market positivity is also normal. Over the same course of 41 years, the annual returns of the market were positive 31 out of 41 years (75% of the time). The market returned an average annual return of 9% per year from 1980 to 2020 and you can increase that average annual return to around 12% per year if you account for reinvested dividends.
As humans, we are hardwired to feel something and then believe that we need to act on our emotions. This instinct may have saved us when we heard foreign noises in the wilds of the past, when this noise was a threat such as a lion or other predatory animal. This instinct is also one that can wipe out decades of investment returns and put your future in jeopardy if you make the wrong decision at the wrong time. The market isn’t risky, human nature is risky.
If you believe that you are at risk of making an impulsive investment decision during stressful times, which we have determined happens every single year, then working with a professional can help you get through these stressful times.
“The four most dangerous words in investing are, it’s different this time.” –Sir John Templeton
No, I’m not starting to sing Aretha Franklin’s hit song, RESPECT, but I have to admit, even as a financial planning professional, RESPs are one of the most confusing investment products in Canada. I find that people have a basic knowledge of them but they may not know how to ensure that they are fully utilized to provide the maximum benefit possible. The government has a website that provides some insight but it can seem clear-as-mud once you start to delve into the details. I have included the link here.
A RESP is short-form for a Registered Education Savings Plan and it is used to help a child with costs that may be associated with a post-secondary education at an eligible education institution. CRA has a list of designated education institutions and they include apprenticeship programs, trade schools, colleges, and universities. A parent can open a RESP for a child but they also have an option to open a Family RESP so that all of the money is pooled in one account and the contributions/investment growth can be utilized by all of the siblings. Anyone can open a RESP in the name of a child, whether it is their child, grandchild, niece, friend, or other relative but we usually recommend that the parent of the child is the registered contributor on file other than in special circumstances. The benefit of the RESP is the fact that the Government of Canada will deposit money into the RESP (in the form of bonds or grants) and these benefits rely on either the amount of contributions that you make annually or the level of income that you have in any given year. If you live in British Columbia or Saskatchewan then there are some Provincial grants that you can utilize but I won’t be getting into the specifics of these in this article. Feel free to reach out if you want to talk about them.
The first federal government benefit, which does not require any money to be actually contributed, is the Canada Learning Bond (CLB). This is meant to help lower-income families put away for a child’s education. A child’s CLB eligibility is only based on the adjusted net family income per year and the number of qualified children in the family. For example, in 2021, if you have between 1 to 3 children and have an adjusted net family income of less than $49,020 then your children would be eligible for the bond this year. The CLB contributes up to $2,000 to an RESP for every eligible child ($500 for the first year of eligibility and $100 each year after as long as the child continues to be eligible up and including the year in which they turn 15).
The other federal government benefit is known as the Canadian Education Savings Grant (CESG) and the amount that your child will receive for this grant is determined by the amount that you have contributed to the RESP in a given calendar year. Essentially, the federal government will give you a grant that equates to 20% of your annual contributions (up to $500 annually). This means that if you contribute $2,500 over the course of a calendar year then the government will give you $500 but if you only contribute $1,000 over the course of a calendar year then the government will give you $200. You can make up for years in which you may not have contributed the maximum but only up to a maximum grant of $1,000 per year. The lifetime CESG maximum that the government will give per child is $7,200. If your child is turning 16 or 17 in the current calendar year then to be eligible to receive the CESG there are a couple different terms. Either the child must have had a minimum of $2,000 in contributions to an RESP before the end of the calendar year in which they turned 15 or a minimum of $100 in annual contributions was made in any four years before the year in which the child turned 15. This can all seem very confusing so if you would like any clarification then feel free to reach out using the form at the bottom of this post.
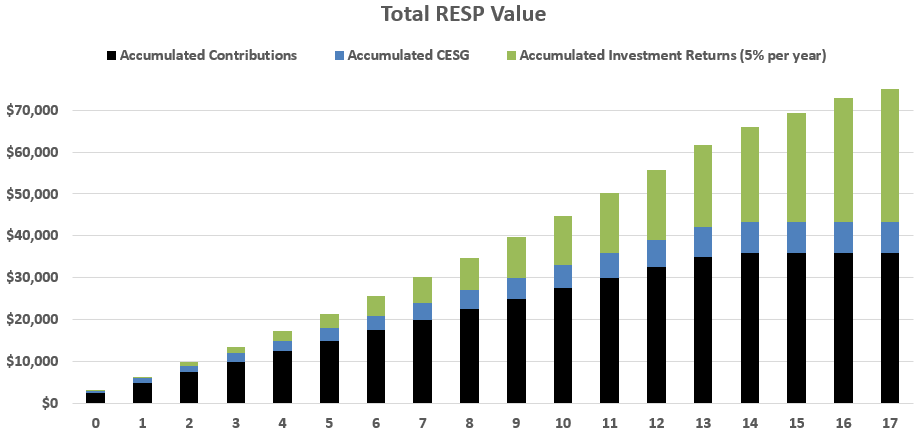
I’ve heard many people say that RESP accounts are just too confusing so they don’t bother with them but these people are potentially missing out on a large benefit when the beneficiary of an RESP chooses what direction they would like to go after high school. If we assume that the child will only receive the CESG and the RESP will earn only 5% on average per year then, by the time the child has reached the adulthood, the contributor would have contributed $36,000, the government would have contributed $7,200, and the investment growth would equate to around $33,300 for a grand total of $76,500. This means that of the $76,500 potential future value of the RESP only 47% was contributed from your own pocket. I’m sure many of the parents reading this wouldn’t mind that kind of extra padding when helping out their child.
Another excuse that I hear about the RESP is that the RESP proceeds are too restricting and must be used on tuition or other specific school related expenses but this is not the case. A withdrawal from the RESP only requires evidence that the child is in a designated education program and then the funds from the withdrawal can actually be used on anything that the child is in need of. Does your child need a car to get to classes? Do they need assistance paying their rent? How about a laptop or meals or furniture for their new apartment? The proceeds from the RESP are actually very flexible as the government doesn’t require any receipts or record of what the funds were spent on.
One last excuse is based on the “penalty” that has to be paid if the child does not end up going to a designated education institution. An individual or family RESP can stay open for 36 years so maybe they don’t know what they want to do today but that does not mean that they won’t in the future. If you didn’t want to keep the RESP open then you can actually collapse the RESP too but the government will claw back all of grant money that they deposited over the years. All of the contributions that you made are returned to you (without tax or penalty). Lastly, the proceeds from investment are subject to tax (in the hands of the contributor) plus a 20% penalty UNLESS you have contribution room and are eligible to contribute to your RRSP (under the age of 72), in which case you can simply contribute the proceeds on save on your next tax bill. This type of transfer to the RRSP is limited to $50,000 per RESP.
This is how a lot of Canadians think when it comes to their investment portfolios, even if it is complete instinct. Canadians, just like the majority of at-home investors around the world, are guilty of having home bias in their portfolios but knowing what it is can help deter you from making it worse. Home bias is one of the many emotional biases that are natural to human behavior but can end up being a determent to your investment performance over a long period of time. Home bias simply means that an investor has a natural inclination to invest in domestic securities rather than foreign securities. The average Canadian has around a 30% allocation to Canadian securities in their investment portfolio but the performance of the Canadian economy only makes up about 3% of the global economy. One of the many reasons why this occurs is the fact that we feel more comfortable with familiarity. We feel more comfortable when we are investing in household names that we see often in our day-to-day lives.
The FTSE (Financial Times Stock Exchange Group) All-World Index and the MSCI (Morgan Stanley Capital International) All-Country World Index are two different indices that are meant to replicate the performance of approximately 99% of all equity markets around the world. Delving deeper into the percentage breakdown by country across both of these indices, it is found that Canada makes up about 3% of the overall weighting. This means that the creators of these indices allocate 3% of the entire world’s stock market performance to Canada so, if you are looking at your portfolio from simply an asset allocation standpoint then, anything over a 3% weighting in Canada would be considered over-weight. Even our own Canada Pension Plan only invests 16.6% of their total assets in Canada.
The rationale as to why you have to be careful when you have a higher allocation in your portfolio to one specific country is due to the fact that not every country’s stock market is the same. If we look at the S&P/TSX Composite Index, Canada’s benchmark index, then you’ll find that Financials (31%), Information Technology (12%), Energy (12%), and Industrials (12%) are the largest 4 sectors and they make up 67% of the overall index. The smallest 4 sectors are Customer Staples (4%), Consumer Discretionary (4%), Real Estate (3%), and Health Care (1%) and only make up 12% of the overall index. The MSCI All-Country Index’s top four sectors are Information Technology (22%), Financials (14%), Consumer Discretionary (13%), and Health Care (12%), which makes up 61% of the index. The bottom four sectors of that index are Materials (5%), Real Estate (3%), Energy (3%), and Utilities (3%), which only make up 14% of that particular index.
The result shows us that by investing only in the S&P/TSX then you are overweight Financials by 17% and Energy by 9%. You are underweight Healthcare by 11%, Information Technology by 10%, and Consumer Discretionary by 9%. All that this means is that Canada’s economy is not an exact replica of the world economy. By having a higher allocation in your investment portfolio to Canada then you may feel more comfortable but you will also have a heightened level of risk due to the fact that your investments will have a heightened reliance on the performance of Canada. You are already reliant on the Canadian economy for your income (if you are working) or your pension (if you are retired) so, as a result, wouldn’t you want to minimize your investment portfolio’s reliance on the Canadian economy too?
As a Canadian, there are many reasons as to why you would have a higher allocation to Canadian securities in certain accounts. Everyone knows the level at which interest rates are at currently (record lows) so investor’s don’t have many alternatives to investing in equities when the average long-term inflation rate in Canada is around 3%. This means that if you aren’t earning more than 3% per year (after-tax) on your money then you are effectively losing purchasing power over time. Another reason is due to the fact that the S&P/TSX provides approximately 2x the yield (dividends) compared to the S&P500 so Canadian investors that are searching for dividends don’t have to look far to find some high dividend paying companies. Lastly, Canadian dividends provide a tax-efficient source of yield for Canadians. If you are receiving your dividends in a non-registered investment account then the difference in marginal tax rates between Canadian eligible dividends and foreign dividends can be as high as 20% in some provinces (without even taking the additional withholding taxes applied against foreign securities into account).
Understanding the benefits and drawbacks of having an investment portfolio that is guilty of home bias is a step in the right direction for any investor. The goals of every investor are different and there is no one-size-fits-all solution so due diligence is recommended before making any changes to your portfolio.
All percentages and sector allocations discussed are as of August 31, 2021 and are subject to change.
The Canadian Bankers Association (CBA) released a new report titled, “Focus: Banks and Consumers,” on September 7, 2021 that advised a greater proportion of Canadians are paying less (or nothing) in bank account service fees than ever before. The report stated that 31% of Canadians say they pay no service fees at all and another 45% pay $15 or less per month. This is a big change from the past and a welcomed response due to the industry adopting a greater emphasis on technology to lower their input costs.
There exists many different options to achieve a fee-less bank account these days, whether you do a quick search online or have a discussion with your bank about the type of accounts that you have. If you put in a little research then it will usually end up saving you money most of the time.
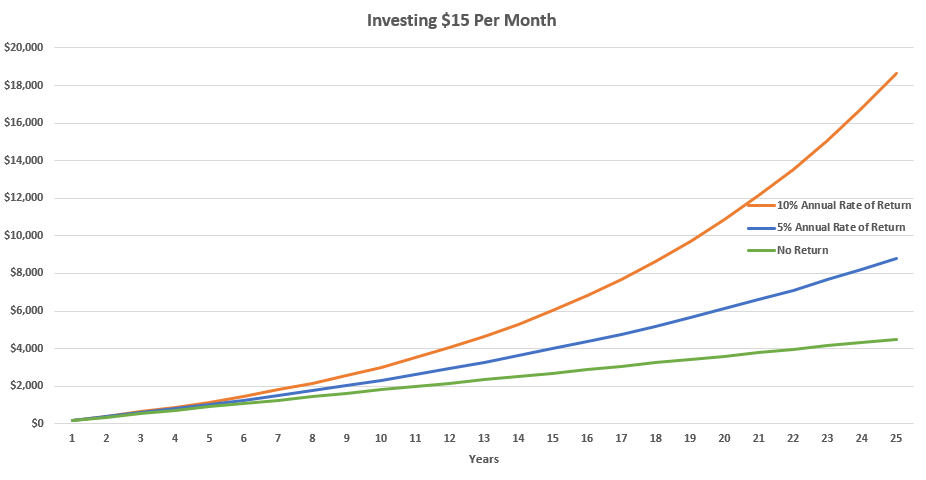
Let’s assume that you are paying the stated total of $15 per month for your accounts. This would work out to an annual expense of $180, which may still seem trivial to some, but this starts to add up over time. If all you did was set the money aside in a bank account then after 5 years you would have put away $900, after 10 years you would have a balance of $1,800, and after 25 years you would have accumulated $4,500.
The real magic starts to happen when you invest the savings into an investment earning a modest return of between 5% to 10% annually. If you can achieve 5% per year, on average, then after 5 years your meager $15 per month savings would have a value of $1,021, after 10 years you would have a value of $2,325, and after 25 years you would have a value of $8,822. If you were to achieve 10% per year, on average, then after 5 years you would have a value of $1,158, after 10 years you would have a value of $3,022, and after 25 years you would have a value of $18,647.
This is the beautiful thing about compounding, as you continue to push the length of time greater into the future then you actually see these meager savings achieve a substantial value.
That’s one way for your bank to pay for your next vacation or a future home renovation. So take a look at your bank statements and ensure that you aren’t paying any account service fees.