The year has just started and Mr. Market did not take long to remind us about the level of volatility that we should expect when it comes to investing in the great companies of the world. Unfortunately, there is no other way to achieve the amazing long-term returns that come with equity investing other than sitting through the volatility that comes along with equity investing.
It’s never easy to sit through these periods of time but you may be making it harder on yourself than it needs to be. My advice is to stop watching your account values, turn off any financial news, and take advantage of the parts of your life that actually bring you enjoyment. This enjoyment may come from visiting with family and friends, cooking a homemade multi-course meal, or spending an afternoon in nature. The goal is to take your mind off of the financial part of your life because, no matter how long you stare at your computer screen, the sea of red will not magically turn green. Why do you care what happens with the total value of your investments from the morning to the afternoon, or from the start of the week to the end. If you are looking to provide yourself with a multi-decade income that will span the rest of your life then why do you care what happens in such short time frames?
If you are concerned, call your advisor. These are the times that you need them most and, since you are paying them either directly through fees/commissions or indirectly through trailer fees, you might as well hear some comforting reminders that should give you piece of mind. Your advisor can review your financial plan with you again, which should allow you to change your frame of thought to be more long-term. If your plan satisfied all your goals prior to this volatility then you are going to be okay after it concludes. I can’t tell you if the market has found its bottom yet, and no one can, so don’t believe any of the financial pundits on financial news networks that may say otherwise. Now is not the time to panic, now is the time to let your plan guide you to see past whatever is happening today.
I’ve found a couple different charts that should help. The first chart provides evidence that the longer you stay invested, the lower the variance that your average annual return will be. The second chart shows the repercussions of your actions if you tried to out-smart Mr. Market in the past.

J.P. Morgan puts together some amazing charts that help explain some of the most important investing principles. Here they have put together a chart that shows the returns of stocks (green), bonds (blue), and a 50/50 balanced portfolio (grey) over multiple length rolling periods from 1950 to 2020. All of the returns that you see listed above are average annual returns based on 70 calendar years.
The chart tells us that if we look at every year individually then investors have experienced a very wide variance of returns over the years:
- Stocks have had annual returns as high as 47% and as low as -39%.
- Bonds have had annual returns as high as 43% and as low as -8%.
- A 50/50 Balanced Portfolio has had annual returns as high as 33% and as low as -15%.
Now, instead of looking at every year individually, let’s look at every 5-year rolling period available over that same 70 year time period:
- Stocks have had average annual returns as high as 28% and as low as -3%.
- Bonds have had average annual returns as high as 23% and as low as -2%.
- A 50/50 Balanced Portfolio has had average annual returns as high as 21% and as low as 1%.
We can do the same for every 10-year rolling period:
- Stocks have had average annual returns as high as 19% and as low as -1%.
- Bonds have had average annual returns as high as 16% and as low as 1%.
- A 50/50 Balanced Portfolio has had average annual returns as high as 16% and as low as 2%.
Lastly, and the best one of of all, we can look at every 20-year rolling period:
- Stocks have had average annual returns as high as 17% and as low as 6%.
- Bonds have had average annual returns as high as 12% and as low as 1%.
- A 50/50 Balanced Portfolio has had average annual returns as high as 14% and as low as 5%.
What the data shows us is that over the course of the 70 years discussed, spanning from 1950 to 2020, there has never been any 5-year time period that a 50/50 Balanced Portfolio has lost money. As well, if you have the risk tolerance to invest 100% in stocks then the lowest annual average return experienced over any 20-year rolling period is 6% per year.
Trying to time the market consistently has been proven again and again to be nearly impossible but people always continue to try. If some of the smartest people in the world haven’t been able to accomplish it then I’d say that you’re better off taking their failed attempts as evidence.
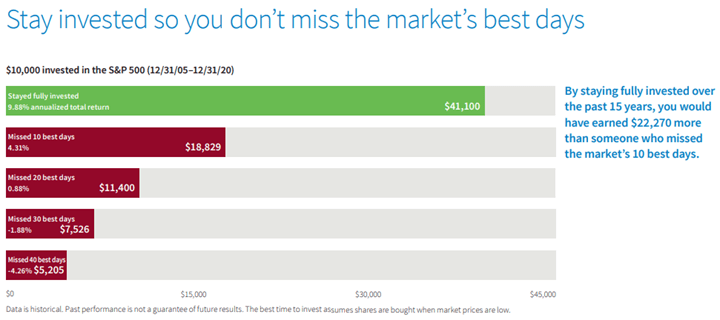
The chart above shows the S&P500 returns from the beginning of 2006 to the end of 2020 (15 years or 5,479 days). This time span also includes the Great Financial Crisis (GFC), which was the most serious global financial crisis since The Great Depression. During the GFC, the market was down as much as -49% and ended the calendar year with a total return of -38% (2008).
- If you stayed the course and remained invested through these tumultuous times then you were rewarded with an annualized return of 9.88% per year.
- If you just so happened to miss out on the best 10 days over that 5,479 day period then your annualized return dropped to 4.31% per year.
- If you missed the best 20 days then you achieved a meager average of 0.88% per year.
- If you missed the best 30 days then you lost any chance of positivity and experienced an average return of -1.88% per year.
- Lastly, if you were unfortunate enough to miss out on the best performing 40 days over that 15 year time period then you experienced a negative average return of -4.26% per year.
Warren Buffett once wrote, “Someone’s sitting in the shade today because someone planted a tree a long time ago.” Think of it like this, if you keep moving a sapling around your yard to try to chase the sun as it moves across the sky everyday then the sapling will eventually die because it never gets a chance to take root. You must choose one spot to plant the young tree and let it grow. There may be seasons that the sapling might not get enough sun or rain but by choosing the right type of tree for the overall climate then you are going to be just fine and your sapling will be able to handle everything that nature throws at it. The person sitting in the shade may be your future-self or it may be the beneficiaries of your estate but, whomever it will be, they will be grateful that you were patient and allowed your sapling to grow into a ancient, towering tree.
I’ll end this article with a chart that spans 95 years, from 1926 to the end of 2021. During this time period, a $1 investment in the S&P500 grew to be worth over $7,500 today. For comparison, that same $1 investment in 3 month US Treasury Bills would have a value of $20, US Treasury Bonds would have a value of $85, and Baa Corporate Bonds would have accrued to a value of $542. Some of the events that transpired over this time period were monumental so take these into consideration when you worry about the events of today. Whatever happens, we will get through it. The only way to achieve the amazing long-term returns that I discussed is to remain invested, diversified, and to stay-the-course.

Want to chat more? Email me at info@financerx.ca
